Bitcoin Falls Below $100K: Technical and On-Chain Analysis
Bitcoin has recently slipped below the crucial $100K support level, signaling a notable bearish move in the market. If buyers fail to hold this key level, we could see another cascade downward toward the $95K range.
Technical Analysis by Shayan
The Daily Chart
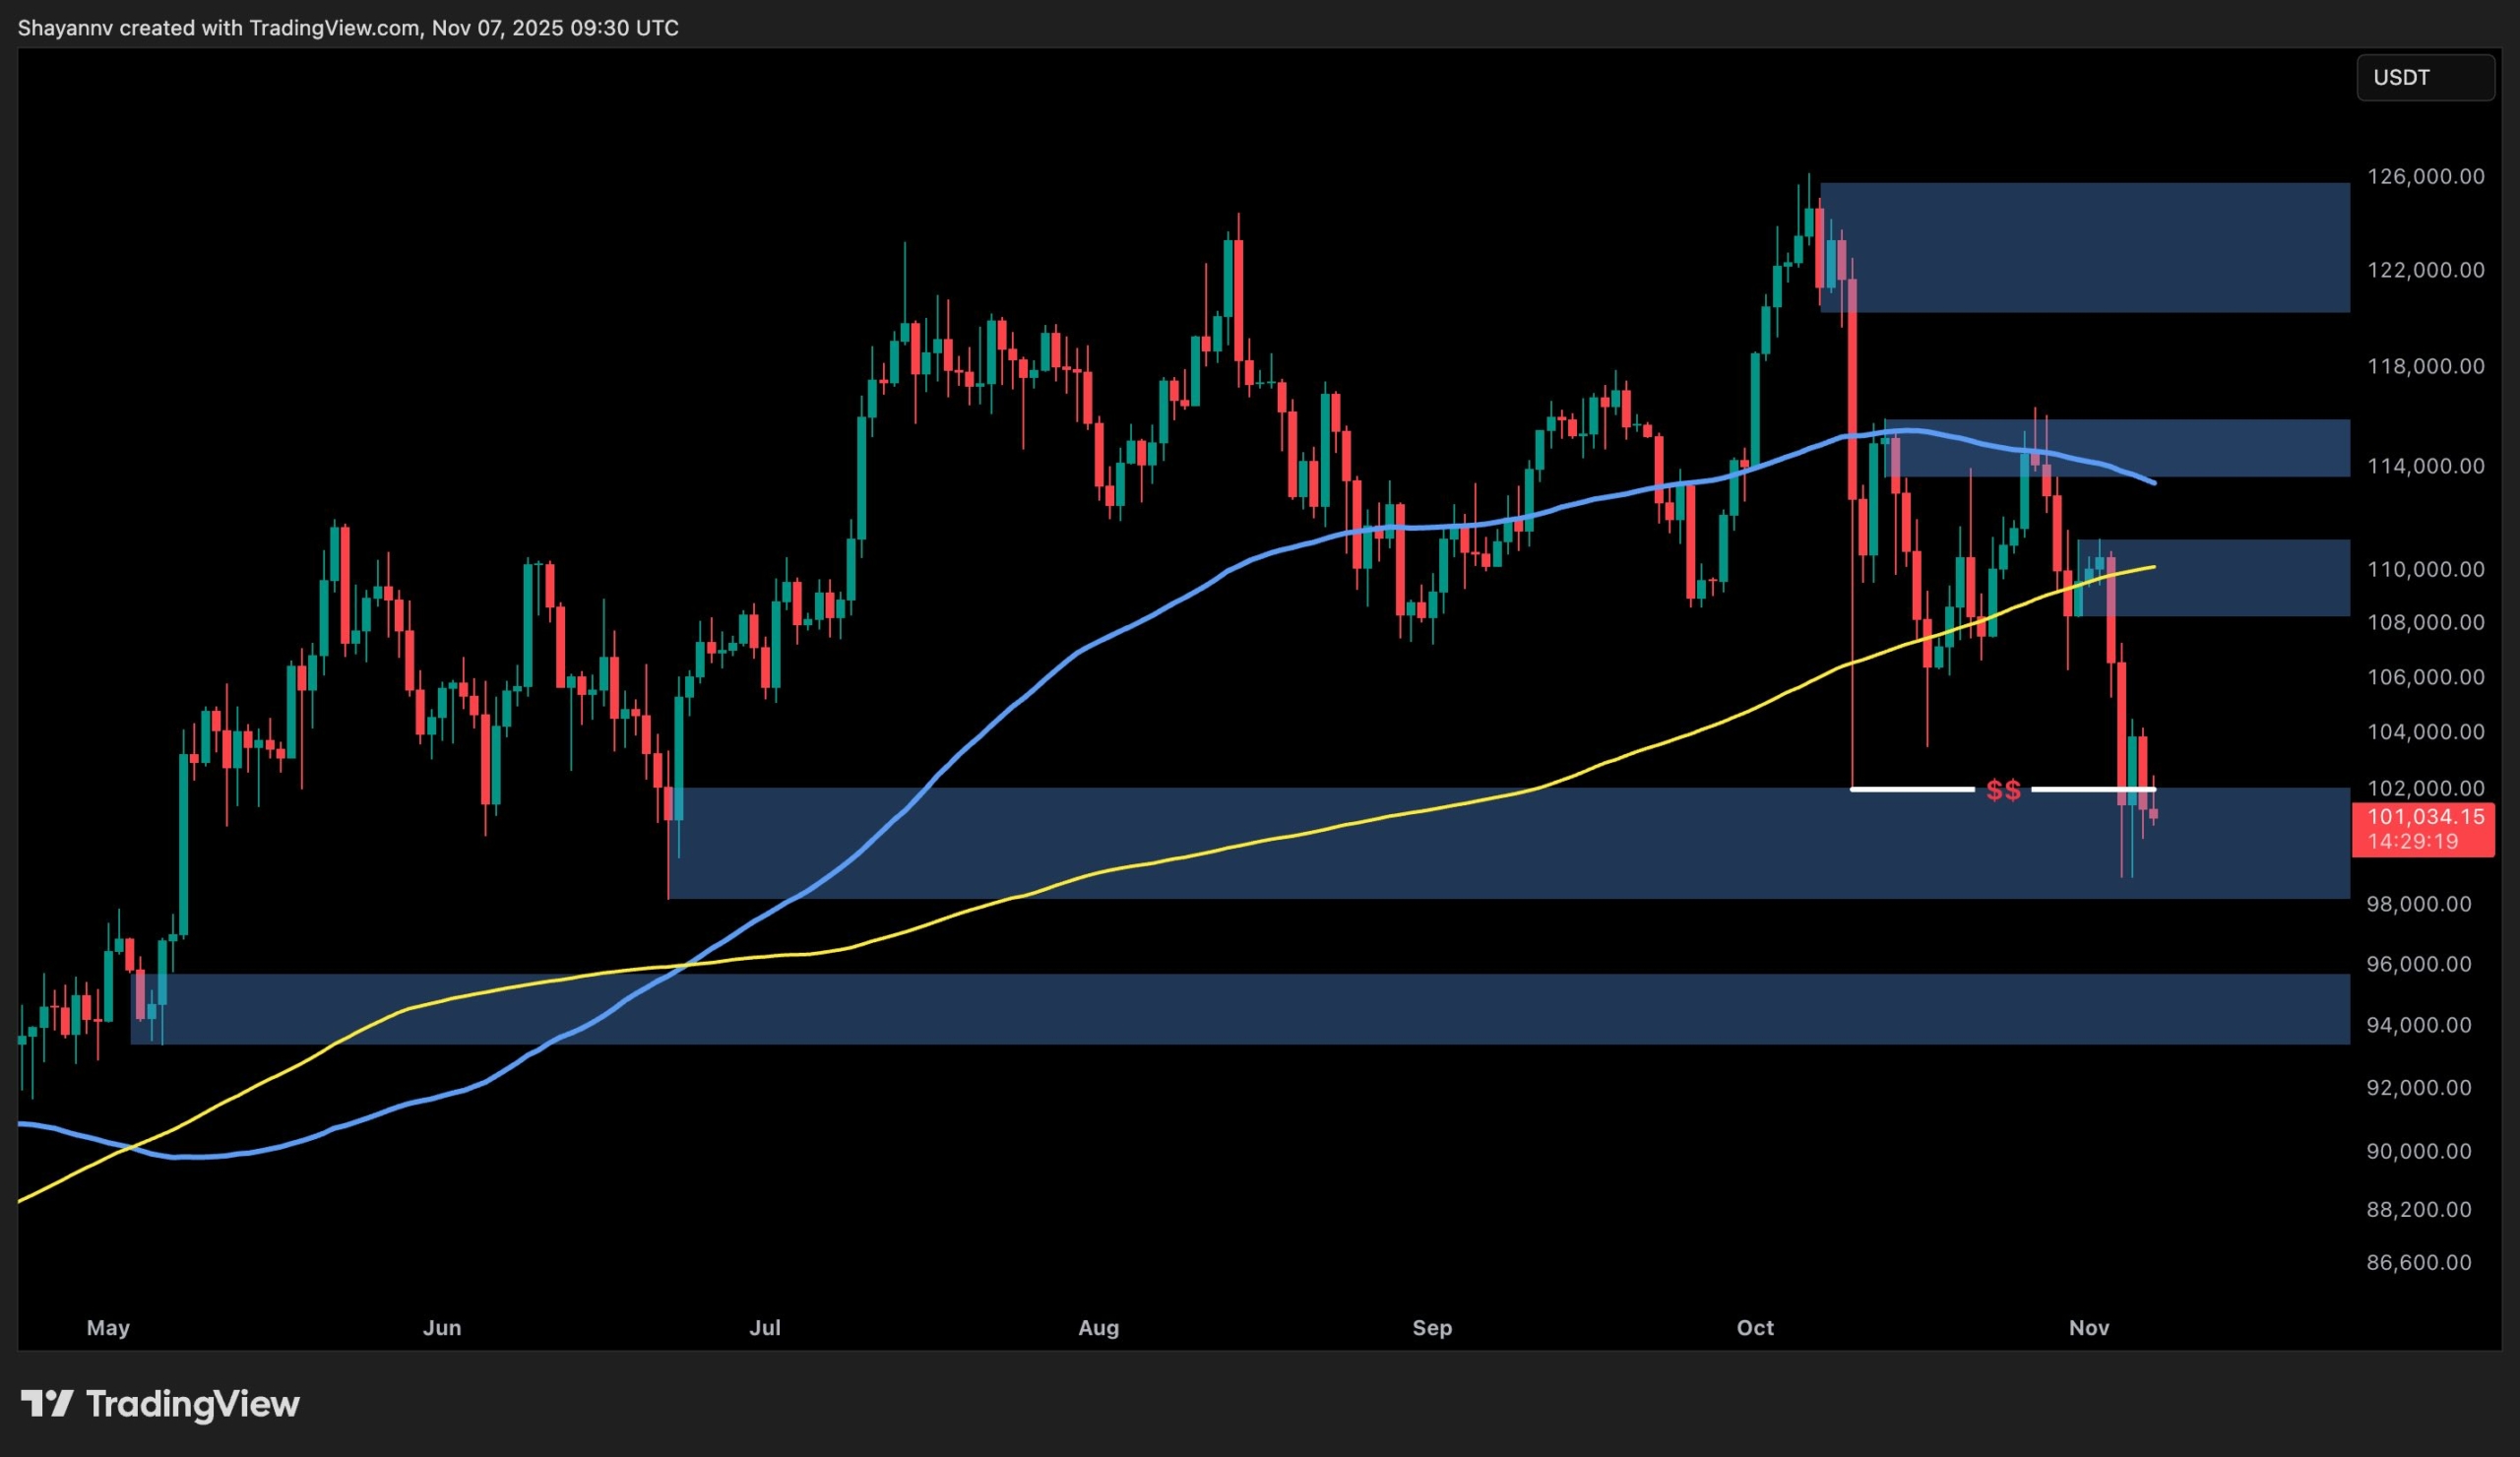
On the daily timeframe, BTC remains locked between the $100K-$102K demand block and the $114K resistance cluster. Both the 100-day and 200-day moving averages are now acting as overhead resistance.
The most recent rejection from the 100-day moving average, around $110K, led to a retest of the $101K support, completing a full liquidity sweep of the previous range low. What stands out is the price stabilization within a historical high-volume node—precisely where previous macro corrections have found their base.
An extended series of equal lows (marked “$$”) suggests that liquidity below $100K has likely been harvested. If this is followed by consolidation and the formation of a higher low, it could confirm that strong hands are absorbing supply.
For bulls, the first confirmation of regained strength would be reclaiming the $106K-$108K range. Meanwhile, for bears, a clean daily close below $99K would open the door to the $93K-$95K macro accumulation zone.
The 4-Hour Chart
Zooming in on the 4-hour structure, we observe a compressed descending range where every lower high is forming closer to support, a classic pattern of momentum exhaustion.
The asset has repeatedly tested the $101K-$102K zone, creating short-term imbalance pockets above $106K and $110K. These areas may later act as magnet levels for corrective rallies.
This coiling behavior often appears near the end of a corrective phase, as leveraged positions are flushed out and volatility contracts.
If the price manages to reclaim the $106K pivot, a short-term reversal toward $110K could follow, completing a mean-reversion move. However, sustained rejection at $104K would keep the accumulation scenario open longer, extending the sideways range through mid-November.
On-Chain Analysis by Shayan
The Realized Price by UTXO Age Bands provides critical insight into the current supply-demand balance among market cohorts.
Bitcoin’s price has dropped below the realized price levels of 1-3 month and 3-6 month holders (represented by purple and blue lines). This means these cohorts are collectively underwater. Their realized price levels, roughly between $107K and $110K, have transformed into overhead supply zones. Many of these short-term holders may exit at breakeven during a rebound, creating initial resistance during recovery phases.
Conversely, the 6-12 month holder cohort’s realized price (yellow line, near $95K-$96K) is emerging as a potential demand boundary. This group, generally more patient mid-term holders, has historically provided market support during late-stage corrections by absorbing supply from capitulating short-term investors.
This distribution of realized prices paints a clear structural picture: Bitcoin is currently trapped between realized supply (short-term loss holders) and realized demand (mid-term strong hands).
A sustained defense above the 6-12 month realized price band would signal that longer-term capital continues to absorb fear-driven selling, maintaining the larger bullish cycle intact. However, a decisive breakdown below that level would indicate a deeper capitulation event, likely resetting sentiment before any macro reversal.
By Shayan
https://bitcoinethereumnews.com/bitcoin/what-are-btcs-next-key-support-levels-if-100k-falls/